 |
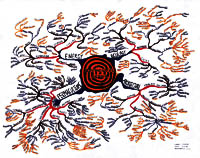
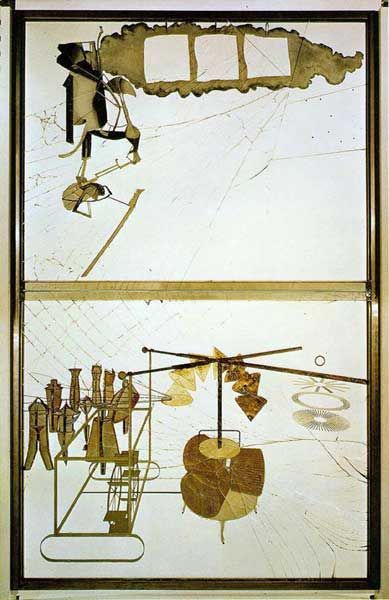
"Each thing seen is the parody of another, or is the same thing in a deceptive form (...) each can be put forward as the principle of things."
G.B. The Solar Anus 1931 |
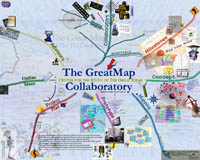
- The simbol " "
is linking to wikipedia related subjects. "
is linking to wikipedia related subjects.
- Some of the images link to related web sites, others are there
for you to use the "see image" comand in your browser.
|
|
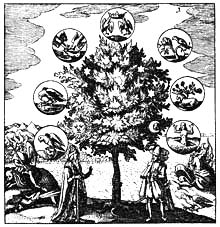
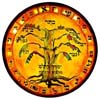
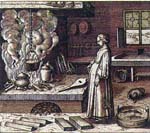
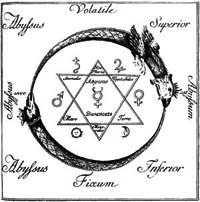
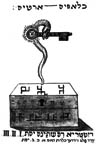
Images from SXIV
to SXVIII?()
Alchemy |
|
 |
 |
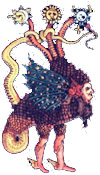 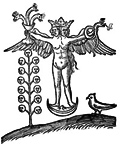
 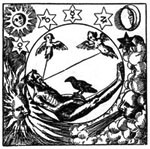
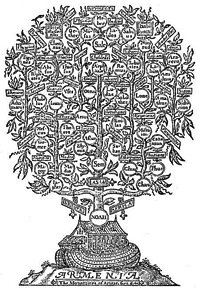
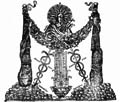
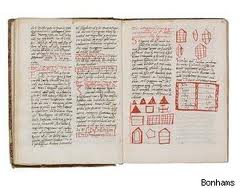
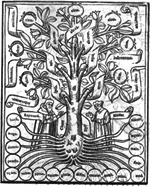
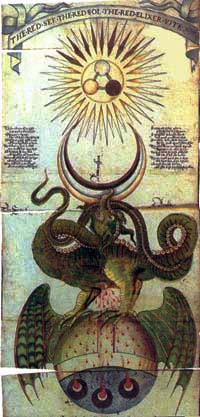
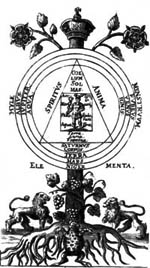
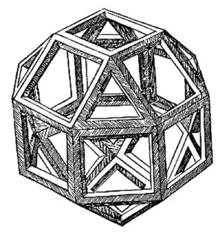
"The Ripley Scroll is an important 15th
century work of emblematic symbolism.
Twenty one copies are known, dating from the early 16th century
to the mid-17th. There are two different forms of the symbolism,
with 17 manuscripts of the main version, and 4 manuscripts of
the variant form. There are very wide variations in the English
text on the different manuscripts, and for the text here I have
modernised and unified a number of versions. This is not a properly
researched edition, but a reworking of the text into a modern
readable form. I add the engravings of the Scroll printed in
David Beuther, Universal und Particularia... Hamburg, 1718."
The alchemy web site
http://www.levity.com/alchemy/rscroll.htm |
 |
 |
 |
   |
to "Sci-Fi"
Title: The New Atlantis
Author: Francis Bacon
Year:1626
|
|
| |
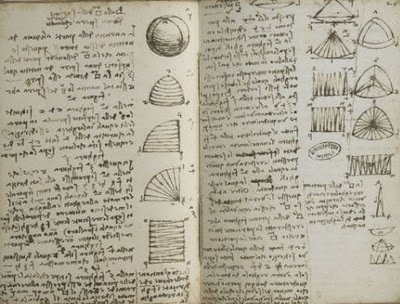
 The flirt between geometry, algebra The flirt between geometry, algebra
and tabular data
|
1100
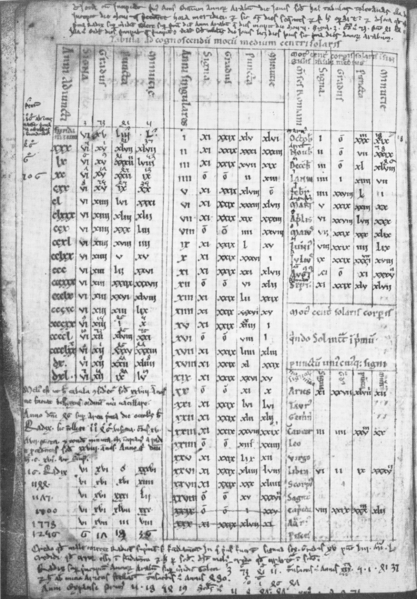 |
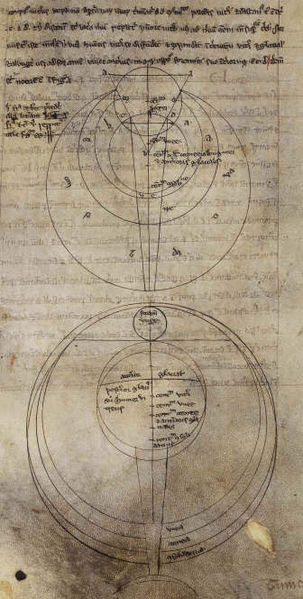
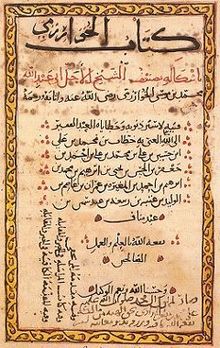
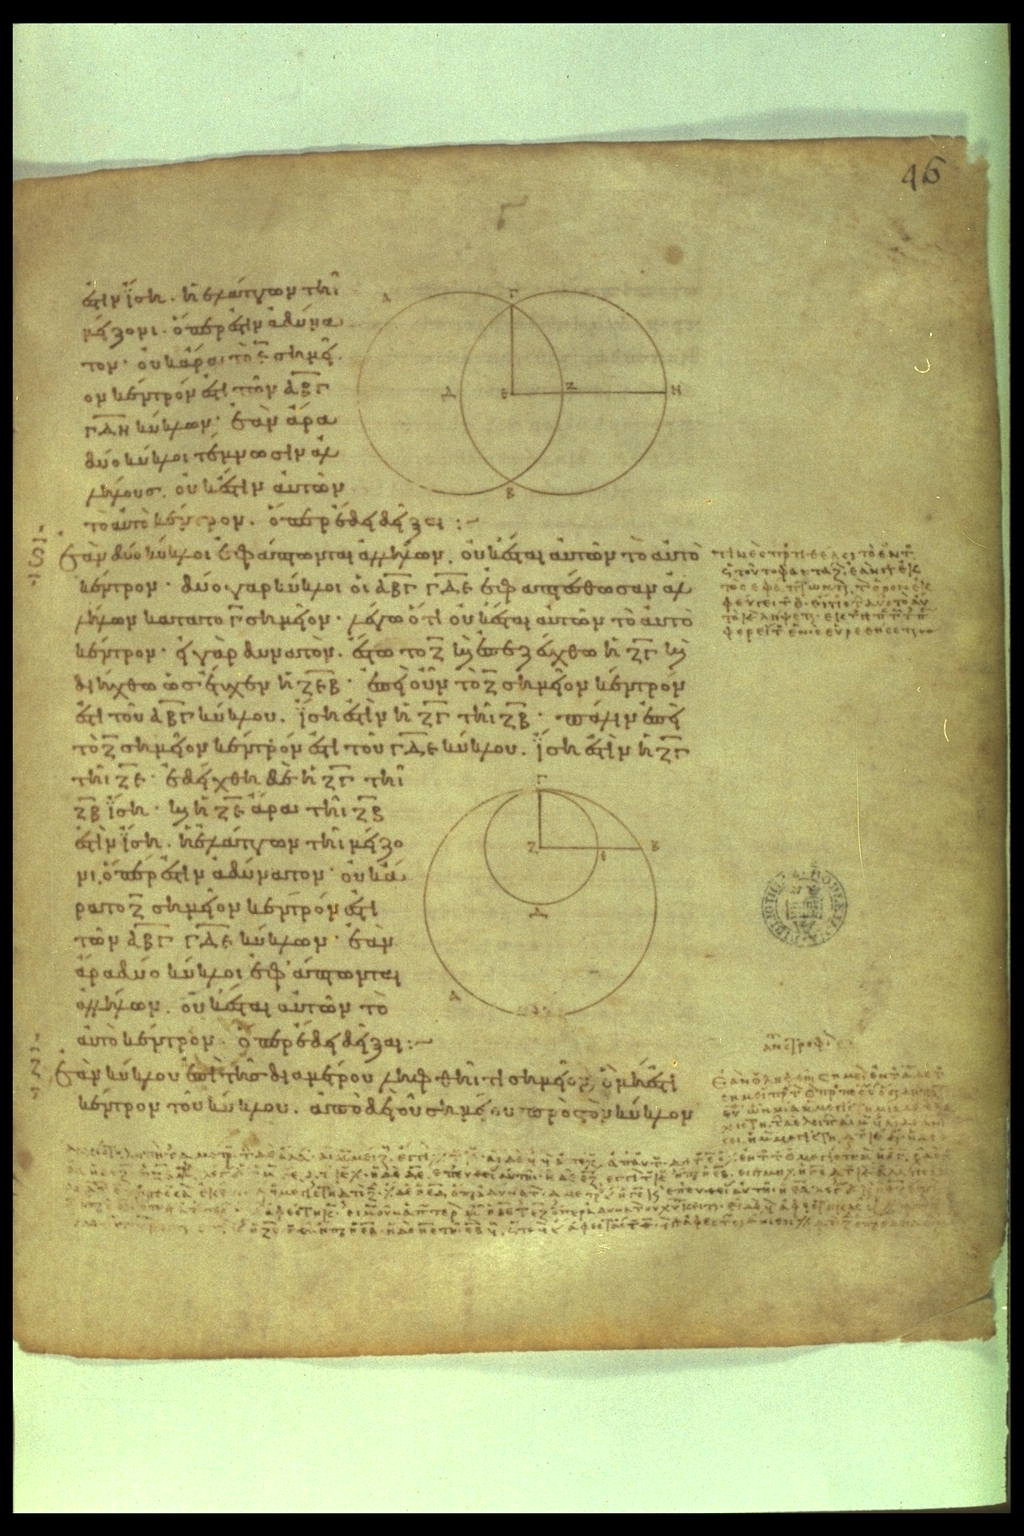
| a XII century latin translation of Al-Khwārizmī's Zīj al-Sindhind (on trigonometry) |
|
1200
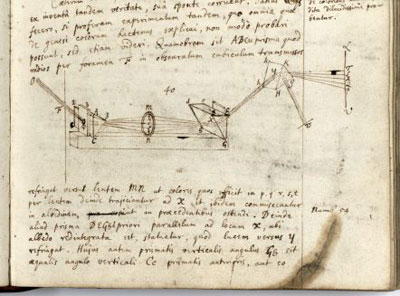
optics study, Roger Bacon

|
1300
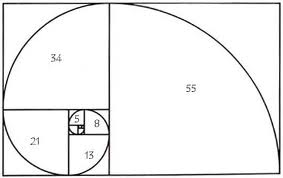
Fibonacci manuscript and the famous pogression.
 |
1300
 |
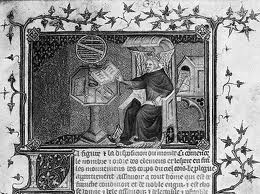
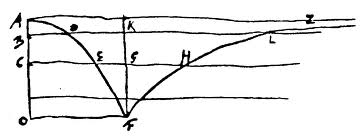
"Bishop Nicholas Oresme developed the first, inchoate form of co-ordinate geometry. In this new space-construction, Oresme used a horizontal and vertical axis—the X- and Y-axes of Cartesian geometry—to locate points in space. In place of the closed curves and triangles of Greek geometry, Oresme predicated a vast, two-dimensional matrix of space, which extended indefinitely in all directions away from the origin. His purpose remained Euclidean: to describe mathematical bodies. But by placing all Euclidean figures in an infinite plane of co-ordinated points, Oresme had already unconsciously subsumed the whole Euclid into a new, Western vision of space"
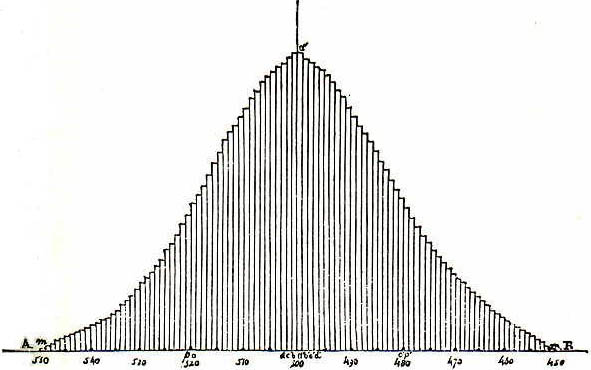
Proto-bar graphs
|
|

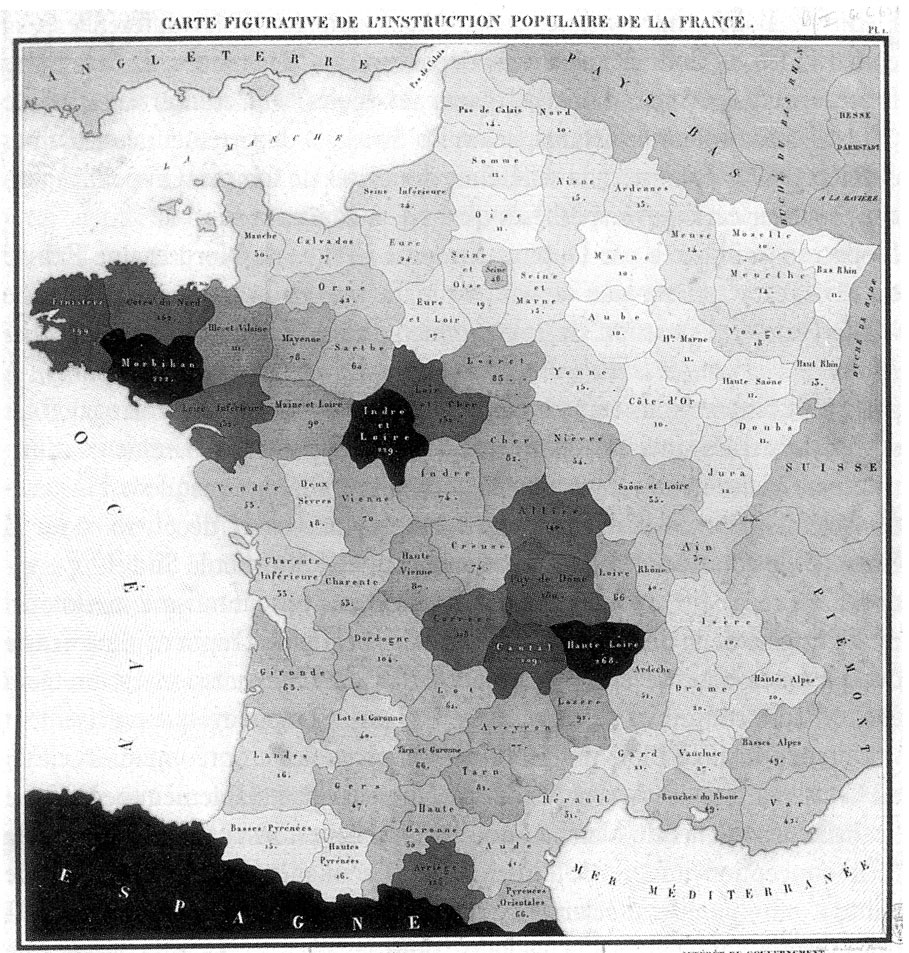
to human geography
|
1817 map of illiteracy in France by Dupin
 |
One of the first examples of geographic methods being used for purposes other than to describe and theorise the physical properties of the earth is John Snow's map of the 1854 Broad Street cholera outbreak. Though a physician and a pioneer of epidemiology, the map is probably one of the earliest examples of Health geography.
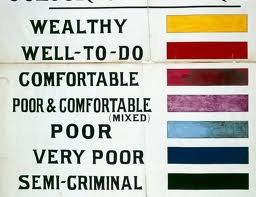
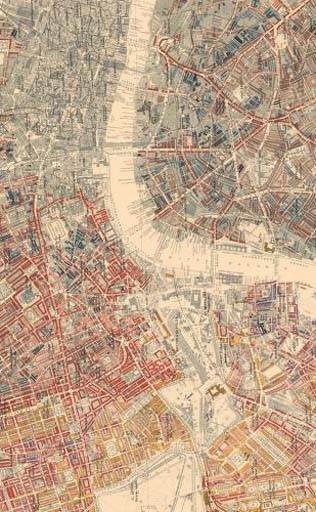
Booth's map of Poverty in London
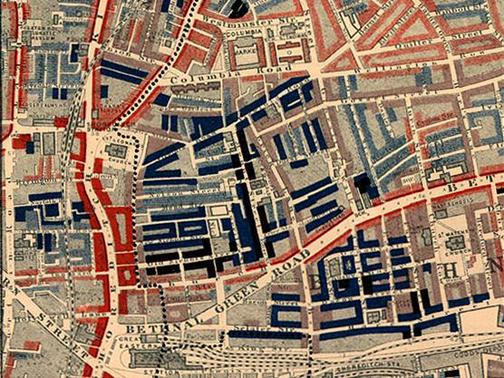 |
1901  Charles Booth is most famed for his innovative work on documenting working class life in London at the end of the 19th century. Charles Booth is most famed for his innovative work on documenting working class life in London at the end of the 19th century. |
 |
|
growing social concern
1906 Pareto noticed that 80% of Italy's land was owned by 20% of the population.He then carried out surveys on a variety of other countries and found to his surprise that a similar distribution applied. |
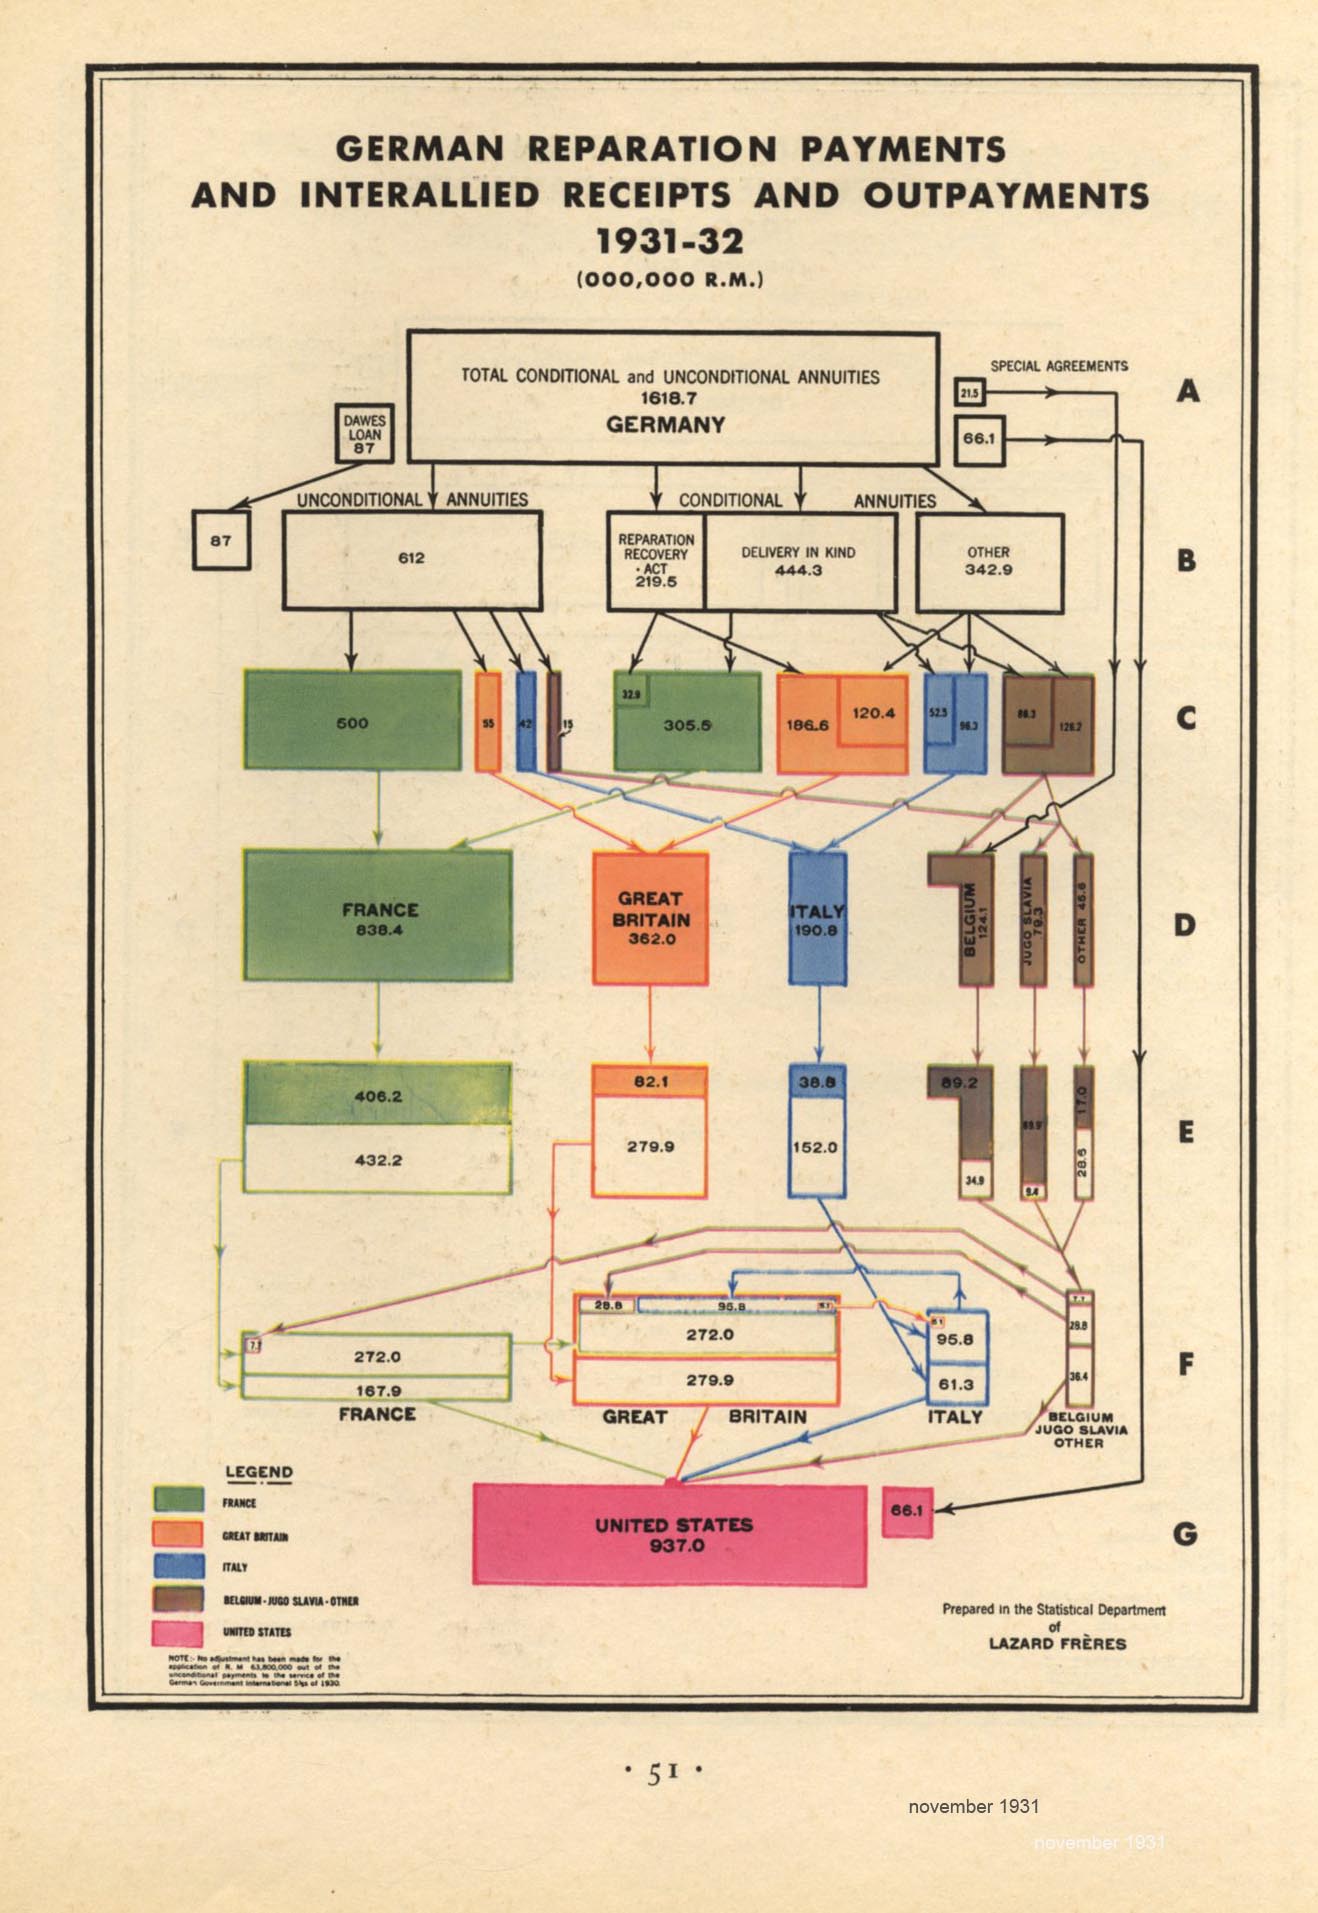
1931
|
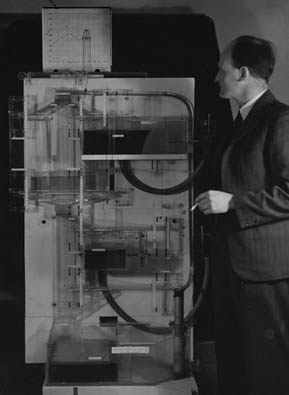
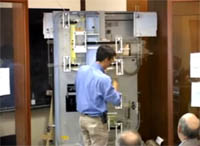
1949
In the Phillips machine, the flow of money around an economy maps to the flow of liquid around the machine. At various points during the flow, proportions of liquid could be routed off into storage vessels representing, say, national savings. Government borrowing is represented by removing money from a storage vessel.
Really what Phillips was trying to produce was a illustrative model of Keynesian economics 
|
 |
|
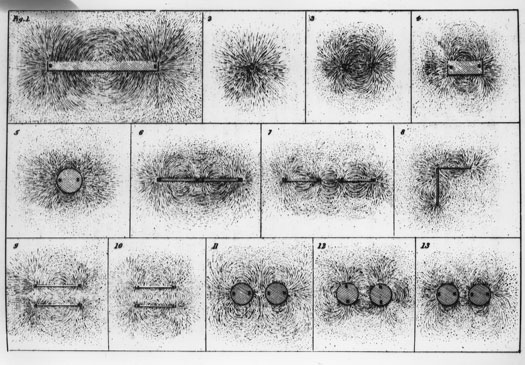
Faraday's magnetic fields 1854 |
early computer imagery.
 |
 |
1843
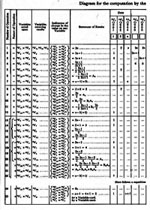
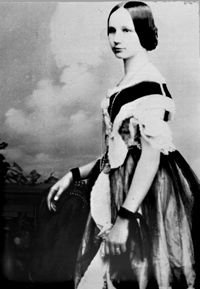
Ada Byron, Lady Lovelace (1815-1852), daughter of Lord Byron and (romantically)
author of the first computer program.
She writed a translation of, and Notes to, Luigi F. Menabrea's. "
Sketch of the analytical engine invented by Charles Babbage, Esq."
(1842/1843) (Christopher D. Green, 2000) http://psychclassics.yorku.ca/
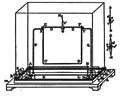
1840
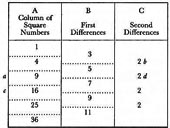
Charles Babbage's Differential Engine – (romantically) the first compute
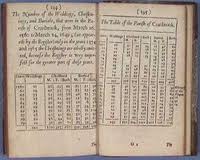
“By 1820, apparently frustrated with the errors he found in
the published mathematical tables of the day, Babbage developed a
design for a machine that would calculate and print them flawlessly.
He called the machine the "Difference Engine" because it
depended on a procedure known as the "method of differences"
for its calculations. (...)
By 1833, however, Babbage had come up idea for a radically new machine,
one that could calculate and print the result of any function at all,
not just those reducible to the method of differences. In 1836 he
hit upon the idea that the operation of this new machine could be
controlled by having it "read" instructions coded into punched
cards, like those used in the automatic loom that had been built by
Joseph-Marie Jacquard in France in 1801. He called the new machine
the "Analytical Engine." (...)” (Christopher D. Green,
2000)
http://psychclassics.yorku.ca/
 ..... .....  |
|

|
“The Four
Color Problem dates back to 1852
when Francis Guthrie, while trying to color the map of counties of
England noticed that four colors sufficed. He asked his brother Frederick
if it was true that any map can be colored using four colors in such
a way that adjacent regions (i.e. those sharing a common boundary
segment, not just a point) receive different colors.
The first published reference is found in Arthur Cayley's, On the
colourings of maps., Proc. Royal Geography Society 1, 259-261, 1879.
There were several early failed attempts at proving the theorem. One
proof of the theorem was given by Alfred Kempe in 1879, which was
widely acclaimed; another proof was given by Peter Tait in 1880. It
wasn't until 1890 that Kempe's proof was shown incorrect by Percy
Heawood, and 1891 that Tait's proof was shown incorrect by Julius
Petersen - each false proof stood unchallenged for 11 years.
In 1890, in addition to exposing the flaw in Kempe's proof, Heawood
proved that all planar graphs are five-colorable; see five color theorem.
Significant results were produced by Croatian mathematician Danilo
Blanuša in the 1940s by finding an original snark. During the
1960s and 1970s German mathematician Heinrich Heesch developed methods
of applying the computer in searching for a proof.
In 1969 British mathematician G. Spencer-Brown claimed that the theorem
could be proven with mathematics he had developed. However, he was
never able to produce a proof.
It was not until 1976
that the four-color conjecture was finally proven by Kenneth Appel
and Wolfgang Haken at the University of Illinois. They were assisted
in some algorithmic work by J. Koch."
http://en.wikipedia.org/wiki/Four_color_problema |
to maths imagery
|
 |
|
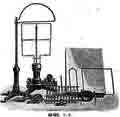
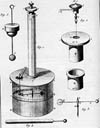
1786
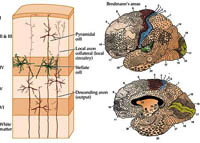
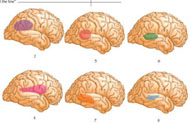
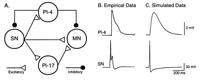
Luigi Galvani demonstrated what we now understand to be the electrical basis of nerve impulses when he made frog muscles twitch by jolting them with a spark from an electrostatic machine.
|
 |
 |
|
 |

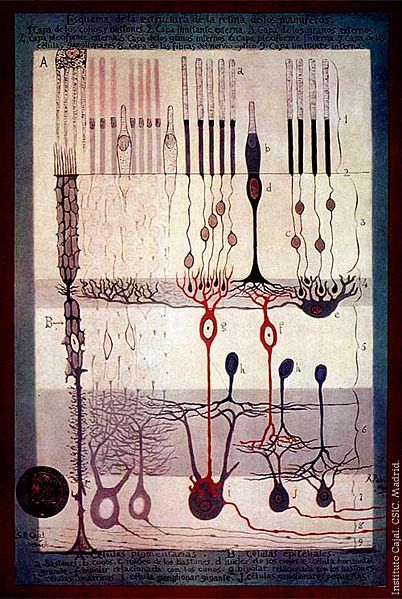
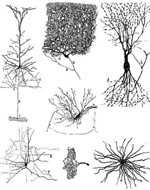
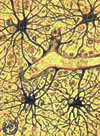
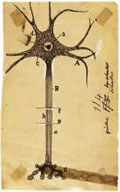
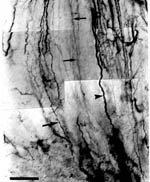
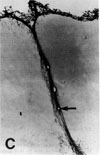
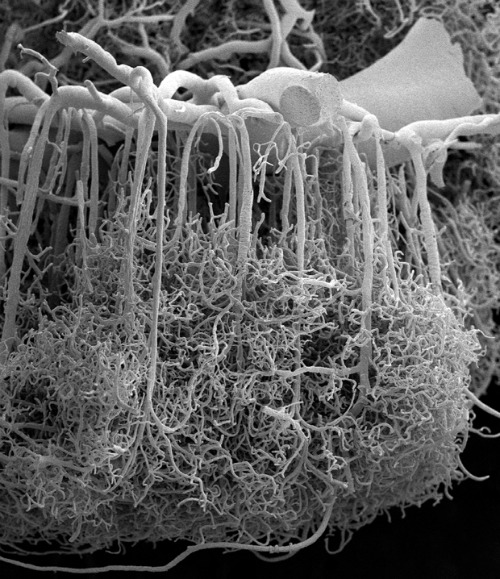
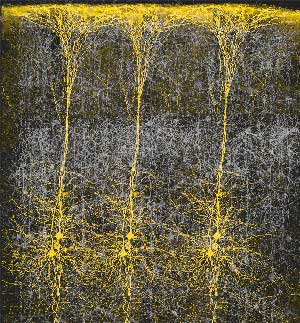
V acation Stories
Five Science Fiction Tales
Santiago Ramón y Cajal
1880 |
|
|
 |

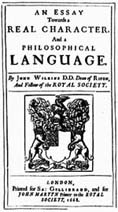
language as network |
1975
Psychohistory is the controversial study of the psychological motivations of historical events.It combines the insights of psychotherapy with the research methodology of the social sciences to understand the emotional origin of the social and political behavior of groups and nations, past and present. Its subject matter is childhood and the family (especially child abuse), and psychological studies of anthropology and ethnology.
This Systemic Psycology analizes the media looking for psicological projections
2:3 Child sacrifice suggestion prior to the Middle East crisis
The Emotional Life of Nations 2002 Lloyd DeMause |
|
1903
Ideoscopy
"You know that I particularly approve of inventing new
words for new ideas. I do not know that the study I call Ideoscopy
can be called a new idea, but the word phenomenology is used
in a different sense. Ideoscopy consists in describing and classifying
the ideas that belong to ordinary experience or that naturally
arise in connection with ordinary life, without regard to their
being valid or invalid or to their psychology. In pursuing this
study I was long ago (1867) led, after only three or four years'
study, to throw all ideas into the three classes of Firstness,
of Secondness, and of Thirdness." (A Letter to Lady Welby,
CP 8.328, 1904)
Phaneroscopy
"Phaneroscopy is the description of the phaneron; and by
the phaneron I mean the collective total of all that is in any
way or in any sense present to the mind, quite regardless of
whether it corresponds to any real thing or not. If you ask
present when, and to whose mind, I reply that I leave these
questions unanswered, never having entertained a doubt that
those features of the phaneron that I have found in my mind
are present at all times and to all minds. So far as I have
developed this science of phaneroscopy, it is occupied with
the formal elements of the phaneron. I know that there is another
series of elements imperfectly represented by Hegel's Categories.
But I have been unable to give any satisfactory account of them."
(Adirondack Lectures, CP 1.284, 1905)
Phenomenology
"Philosophy is divided into (a) Phenomenology; (b) Normative
Science; (c) Metaphysics.
Phenomenology ascertains and studies the kinds of elements universally
present in the phenomenon; meaning by the phenomenon, whatever
is present at any time to the mind in any way. Normative science
distinguishes what ought to be from what ought not to be, and
makes many other divisions and arrangements subservient to its
primary dualistic distinction. Metaphysics seeks to give an
account of the universe of mind and matter. Normative science
rests largely on phenomenology and on mathematics; metaphysics
on phenomenology and on normative science." ('A Syllabus
of Certain Topics of Logic', EP 2:259, 1903) |
|
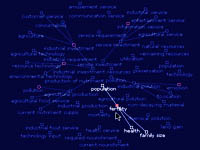
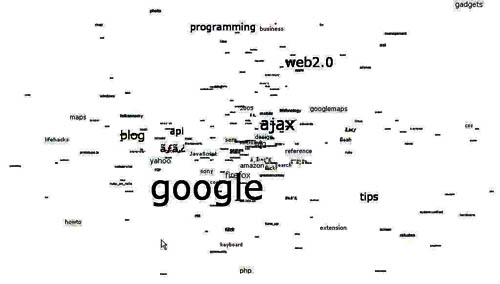
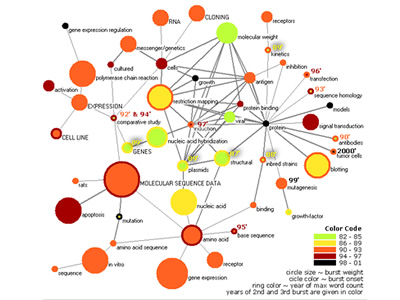
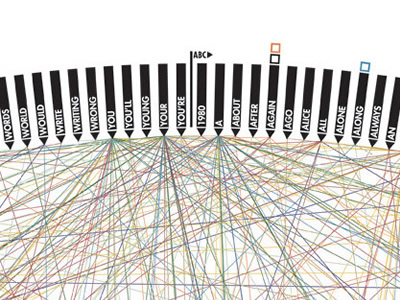
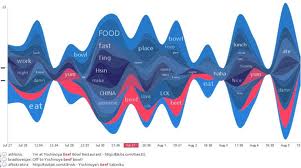
The Speech Mass , statistically presented by computational linguistics
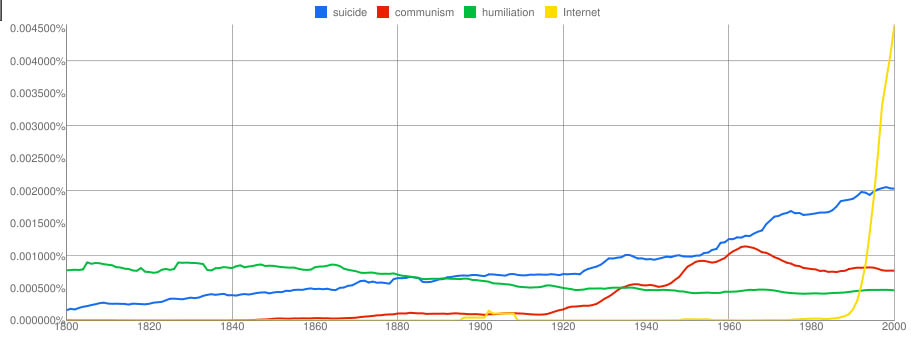
The Google Labs N-gram Viewer is the first tool of its kind, capable of precisely and rapidly quantifying cultural trends based on massive quantities of data. The browser is designed to enable you to examine the frequency of words (banana) or phrases ('United States of America') in books over time. You'll be searching through over 5.2 million books: ~4% of all books ever published! (an analogous system was used in previously comented discipline of psicohistory^)
Culturonomics
|
 |
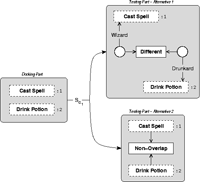
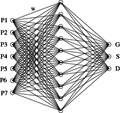
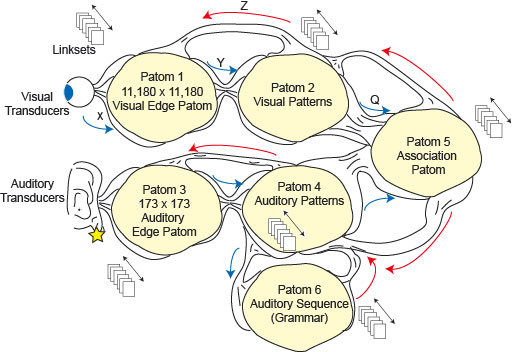
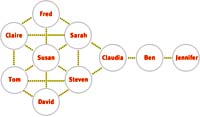
(1968Semantic Networks :
“The
term dates back to Ross Quillian's Ph.D. Thesis (1968)
(...)
Quillian's basic assumption was that the meaning of a word could
be represented by the set of its verbal associations. To see
what this means, imagine that, in the course of reading a novel,
you come across the word `dugong' and the context does not make
clear what the word refers to. So you look up the word in a
dictionary, and there you find, not the object or the property
or the action itself, but rather a definition made up of other
words”
Mike Sharples, David Hogg, Chris Hutchison, Steve Torrance,
David Young
http://www.informatics.susx.ac.uk/books/computers-and-thought |
 |
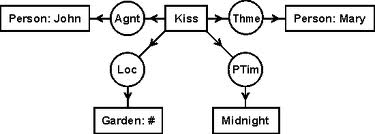
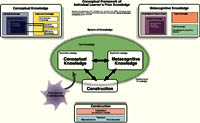
1976 Conceptual graphs (CGs) are a formalism for knowledge representation. In the first published paper on CGs, John F. Sowa (Sowa 1976) used them to represent the conceptual schemas used in database systems. The first book on CGs (Sowa 1984) applied them to a wide range of topics in artificial intelligence, computer science, and cognitive science.
 |
   |
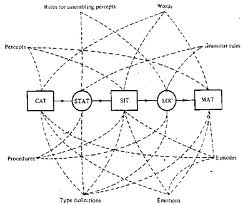
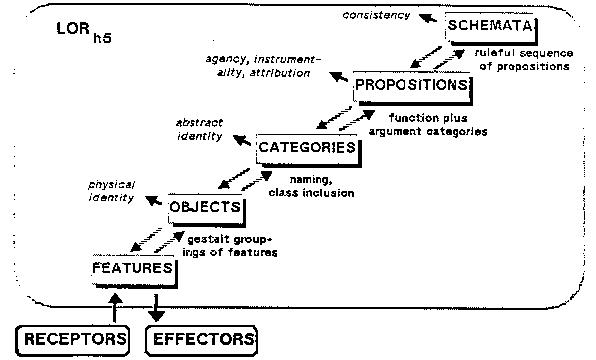
Cognitive psychology second
assumption:
Internal mental processes can be
described in terms of rules or algorithms
in information processing models |
|
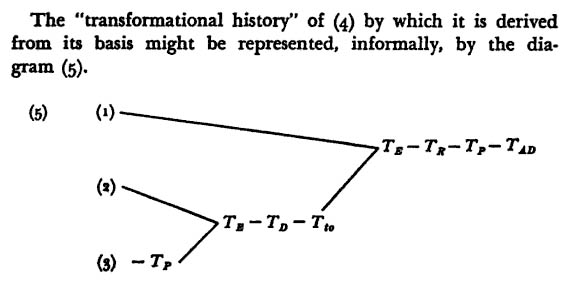
Chomsky 1968
Greenwald
1988
1956..
The Cognitive Revolution began in the mid-1950s when researchers in several fields began to develop theories of mind based on complex representations and computational procedures (Miller, 1956; Broadbent, 1958; Chomsky, 1959; Newell, Shaw, & Simon, 1958). Cognitive psychology became predominant in the 1960s (Tulving, 1962; Sperling, 1960). Its resurgence is perhaps best marked by the publication of Ulric Neisser’s book, ‘’Cognitive Psychology’’, in 1967. Since 1970, more than sixty universities in North America and Europe have established cognitive psychology programs.
Axel Buchner 1994
|
|
From very early computer imagery.
from the robot

 |
|
cognitive imagery |
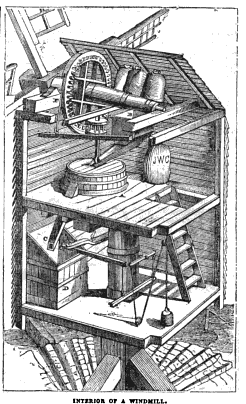
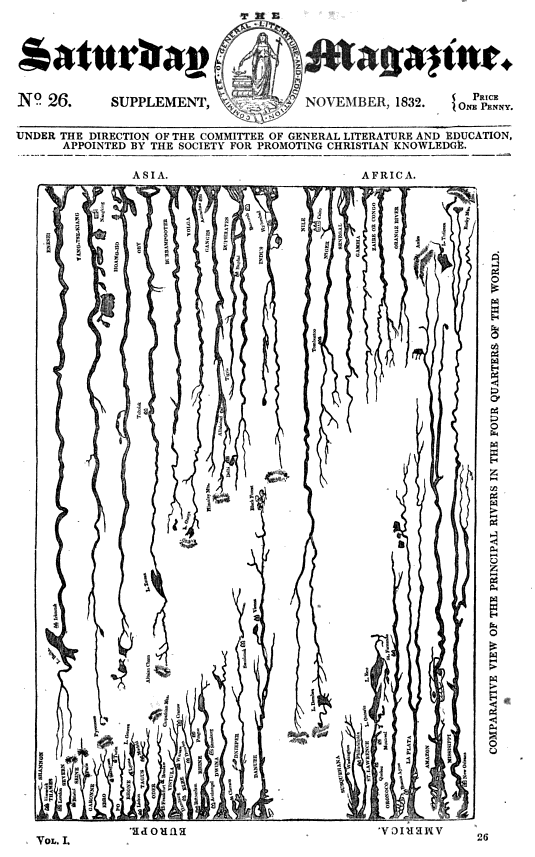
machinic imagery from the London Magazine, 1832

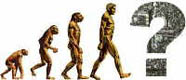
Pierre Teilhard de Chardin Jesuit priest who trained as a paleontologist and geologist and took part in the discovery of both Piltdown Man and Peking Man. Teilhard conceived the idea of the Omega Point and developed Vladimir Vernadsky's concept of Noosphere. Some of his ideas came into conflict with officials in the hierarchy of the Catholic Church and several of his books were censured.
Omega point is a term he invented to describe the maximum level of complexity and consciousness to which the universe seems to be evolving
antropology and history |
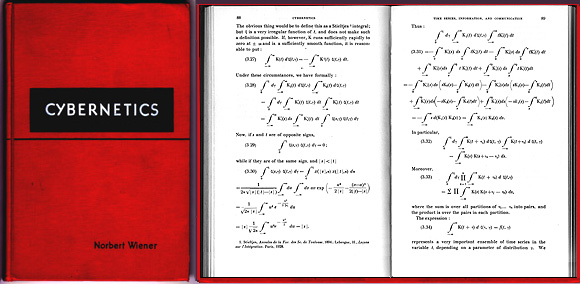
CYBERNETICS IMAGERY1900s-2010s
Cybernetics is the interdisciplinary study of the structure of regulatory systems. Cybernetics is closely related to control theory and systems theory. Both in its origins and in its evolution in the second-half of the 20th century, cybernetics is equally applicable to physical and social (that is, language-based) systems.
World Systems
Research |
 
Alexander Aleksandrovich Bogdanov
was a Russian physician, philosopher, science fiction writer, and revolutionary of Belarusian ethnicity. He was a key figure in the early history of the Bolshevik faction of the Russian Social Democratic and Labor Party, being one of its cofounders and a rival to Lenin until being expelled in 1909. He invented an original philosophy called “tectology,” now regarded as a forerunner of systems theory. He was also an economist, culture theorist, science fiction writer, and political activist.
Tectology
|
(By 1900, the French solidified their cultural influence in Brazil through the establishment of the Brazilian Academy of Fine Arts. São Paulo still lacked a university, however, and in 1934 francophile Julio de Mesquita Filho invited anthropologist Claude Lévi-Strauss and Braudel to help establish one. The result was formation of the new University of São Paulo. Braudel later said that the time in Brazil was the "greatest period of his life.")
|
1950
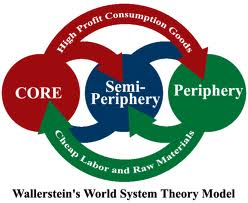
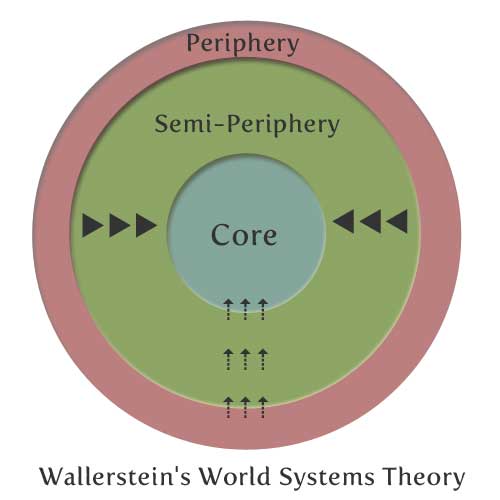
Fernand Braudel has been considered one of the greatest of the modern historians who have emphasized the role of large-scale socioeconomic factors in the making and writing of history. He can also be considered as one of the precursors of World Systems Theory
Immanuel Wallerstein is an American sociologist, historical social scientist, and world-systems analyst.
Andre Gunder Frank was a German-American economic historian and sociologist who was one of the founders of the Dependency theory and the World Systems Theory in the 1960s. He employed some marxian concepts on political economy
Giovanni Arrighi Although in many ways intellectually close to Immanuel Wallerstein, Arrighi tends to ascribe greater significance to the recent shift in economic power to East Asia. He also emphasized his debt to Adam Smith, Max Weber, Karl Marx, Antonio Gramsci, Karl Polanyi and Joseph Schumpeter.
|
|
1995 Journal od World-Systems Research |
* |
 1960 1960 1969 1969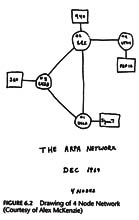
|
.  
|
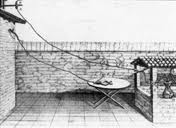
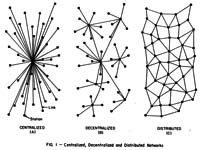
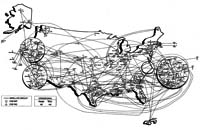
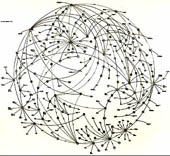
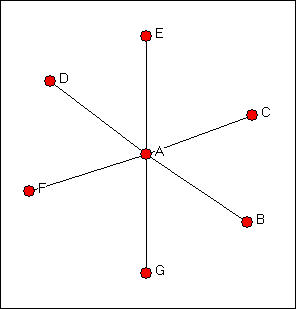
The pioneering research of Paul Baran
in the 1960s, who
envisioned a communications network that would survive a major enemy
attacked. The sketch shows three different network topologies described
in his RAND Memorandum, "On Distributed Communications: 1. Introduction
to Distributed Communications Network" (August 1964). The distributed
network structure offered the best survivability |
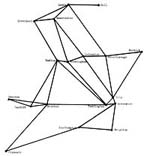
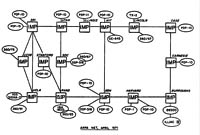
“A rough
sketch map of the possible topology of ARPANET by Larry Roberts. The
map was drawn in the late 1960s
as part of the planning for the network.
(Scanned from Where Wizards Stay Up Late: The Origins of the Internet,
by Katie Hafner and Matthew Lyon, page 50.)” |
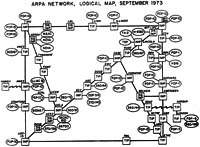
“The
first node on ARPANET at University California Los Angeles (UCLA)
on the 2nd of September 1969.
(Source : "Casting the Net", page 55)”
|
http://www.computerhistory.org/exhibits/internet_history/
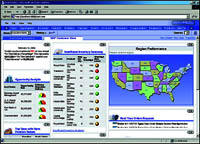
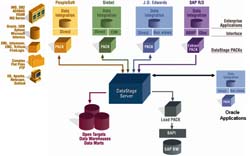
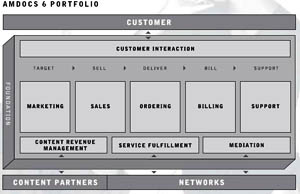
1950 >1990 customer surveillance customer surveillance
and management imageries

 |
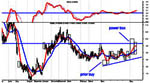
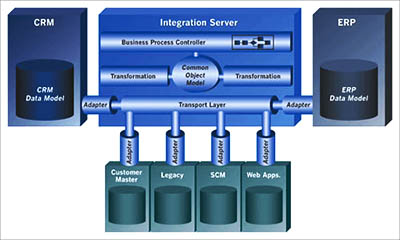
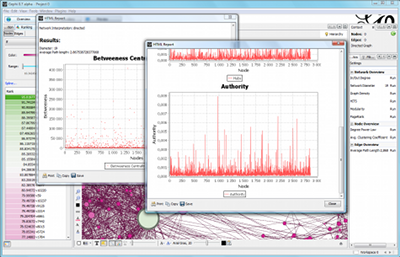
Data mining is the process of applying these methods to data with the intention of uncovering hidden patterns.It has been used for many years by businesses, scientists and governments to sift through volumes of data such as airline passenger trip records, census data and supermarket scanner data to produce market research reports. (Note, however, that reporting is not always considered to be data mining.)
The premier professional body in the field is the Association for Computing Machinery's Special Interest Group on Knowledge discovery and Data Mining (SIGKDD).[citation needed] Since 1989 they have hosted an annual international conference and published its proceedingsand since 1999 have published a biannual academic journal titled "SIGKDD Explorations" |
(Earlier Business grafic culture)
art world network
imagery

   1972 1972 |
|
2000's 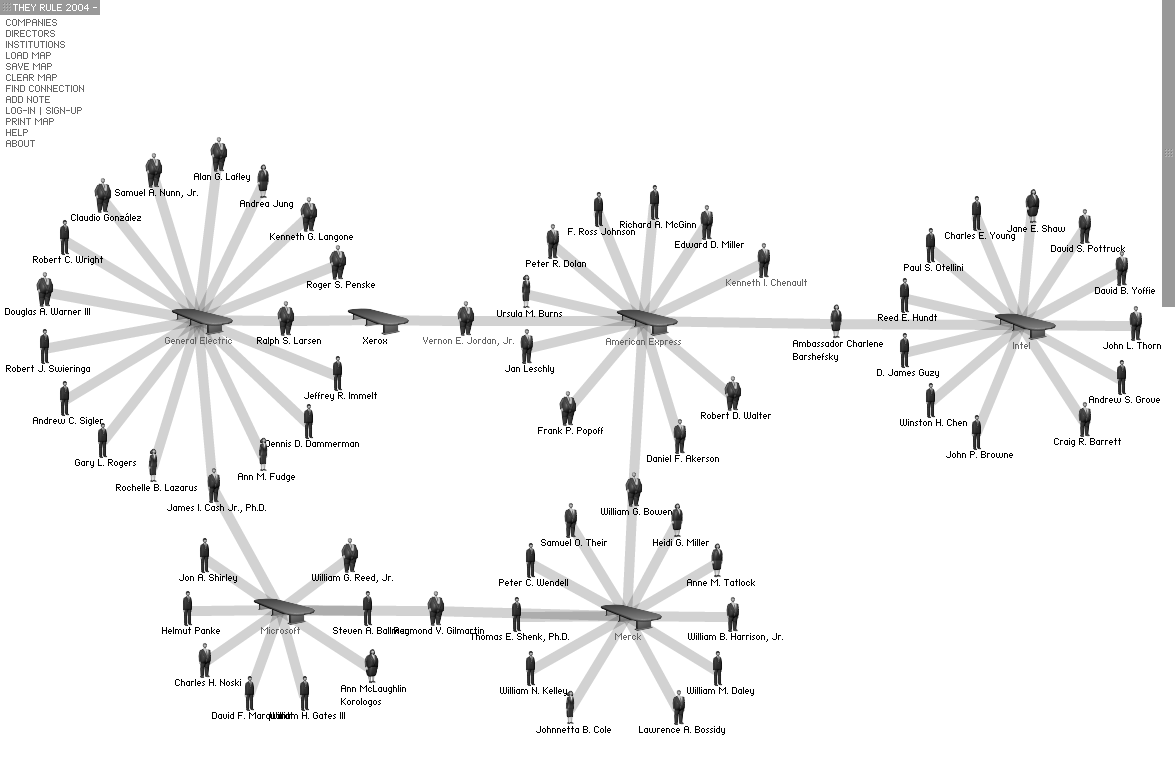 
 |
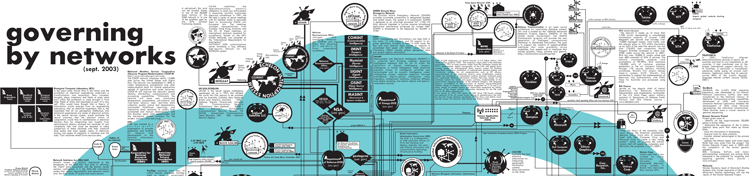
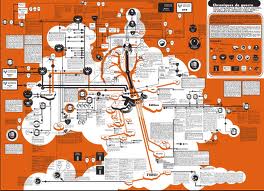
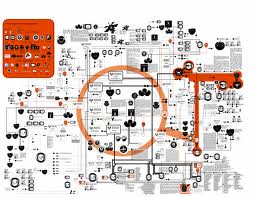
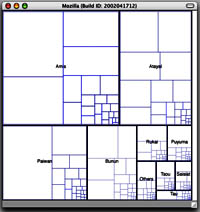
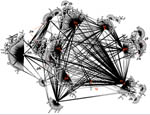
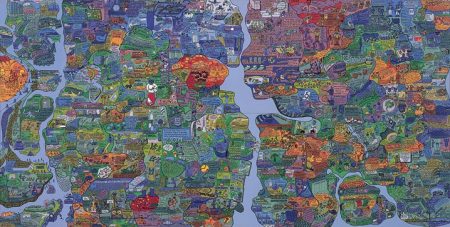
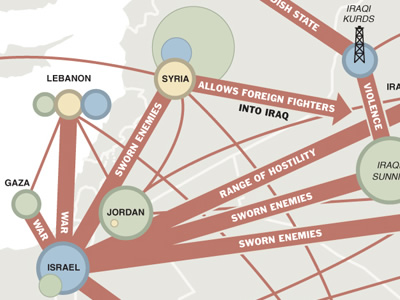
2003 "The Paris-based conceptual group, Bureau d'études, works intensively in two dimensions. For a recent exhibition called 'Planet of the Apes' they have created integrated wall charts of the ownership ties between transnational organizations, a synoptic view of the world monetary game." Brian Holmes
"Léonore Bonaccini and Xavier Fourt form the artist-duo Bureau d´études. For the last several years, the French Group has been producing cartographies of contemporary political, social and economic systems. The visual analysis of transnational capitalism is based on extensive research and usually is presented in the form of large-sized murals. ‘Governing by Networks’, a chart produced in 2003, visualizes the mutual involvements and dependencies within the global media conglomerates. Revealing what normally remains invisible and contextualising apparently separate elements within a bigger whole, these visualizations of interests and cooperations re-symbolize the unseen and hidden" |
|
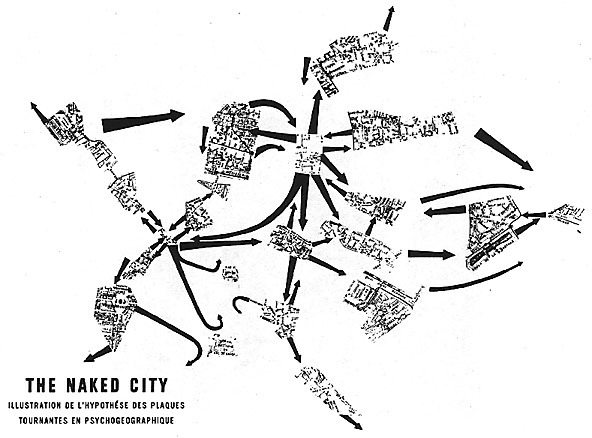
< 1954 psycogeography
Psychogeography was originally developed by the Lettrist International in the journal Potlach. The originator of what became known as unitary urbanism, psychogeography, and the dérive was Ivan Chtcheglov, in his highly influential 1953 essay "Formulaire pour un urbanisme nouveau"
Guy Debord and others worked to clarify the concept of unitary urbanism, in a bid to demand a revolutionary approach to architecture
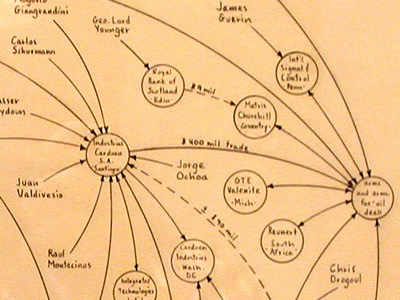
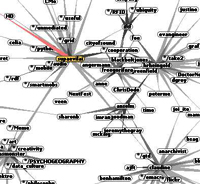
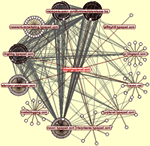
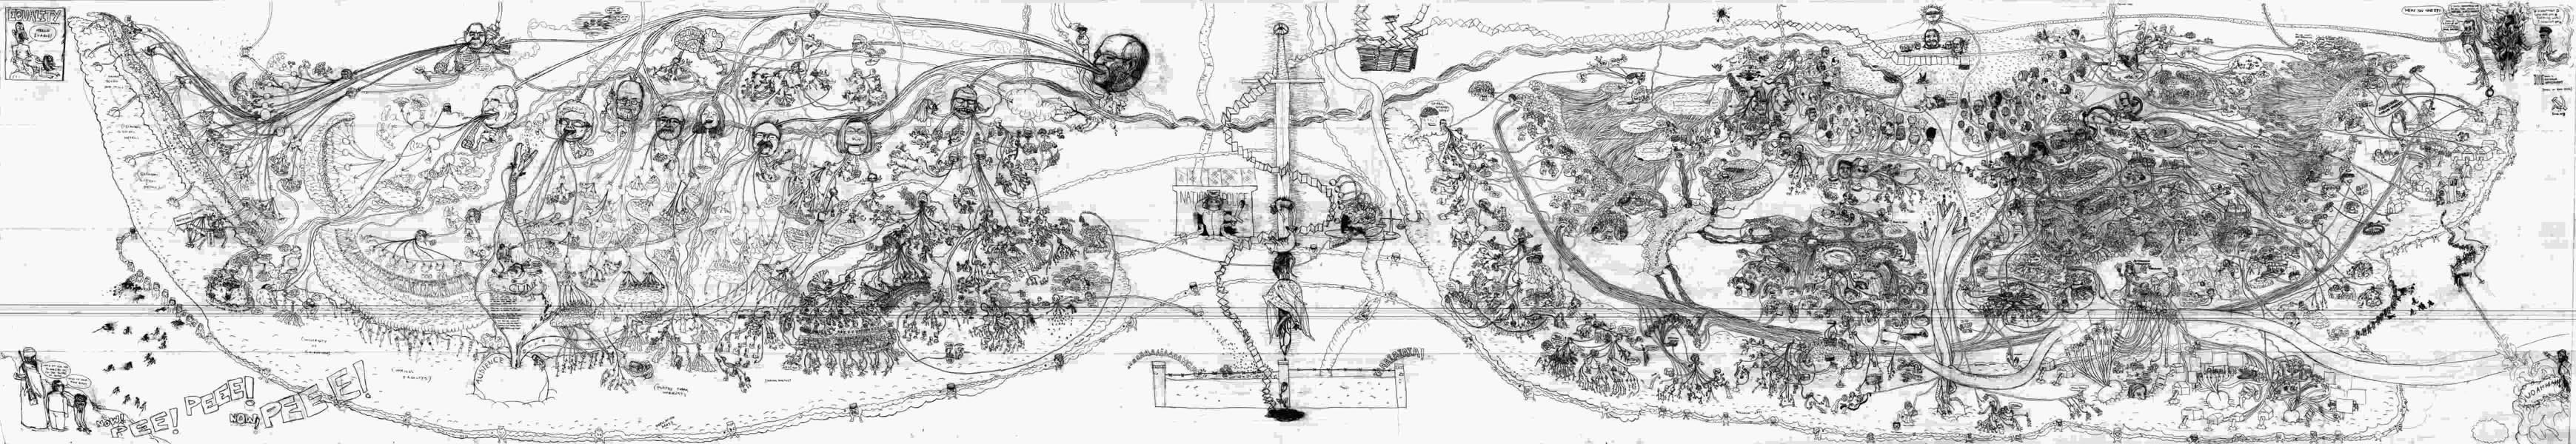
< 1990 Mark
Lombardi
Mark Lombardi (1951 – March 22, 2000) was an American Neo-Conceptualist and an abstract artist who specialized in drawings attempting to document financial and political frauds by power brokers, and in general 'the uses and abuses of power'
While for most of his career, Lombardi was an abstract painter of no particular note (he pursued it sort of as a hobby during his actual career as an archivist and reference librarian), six years before his death he switched to the pencil diagrams of crime and conspiracy networks that he would be come best known for.


Escape the overcode (2007)
Cartography with your feet (2010)
|
2000's Brian Holmes is an American Born (California) theorist, writer and translator living in Chicago, Illinois. Brian Holmes is a Professor of Philosophy at the European Graduate School in Saas-Fee, Switzerland, where he teaches an intensive summer seminar. He has worked with the French Graphics collective Ne Pas Plier (Do Not Bend)from 1999 to 2001. and the French cartography collective Bureau d'Etudes
His articles on Cartography (< at left) represent a public face of what has become a widespread interest in cartography among the art-world community, wich most often comes along with political concern, and the least pure abstract, mathematical and "hardcore-science" implications. |
  |
|
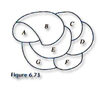
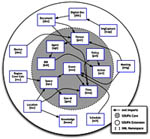
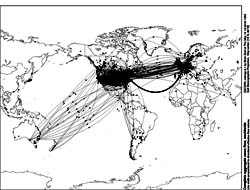
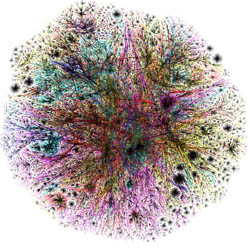
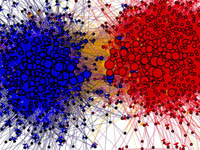
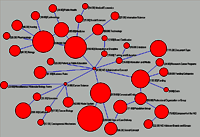
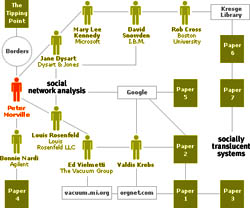
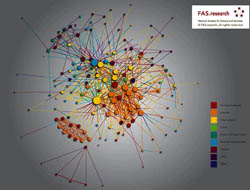
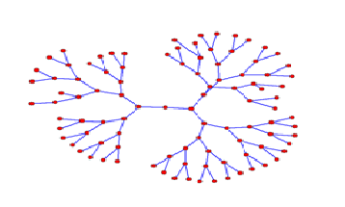
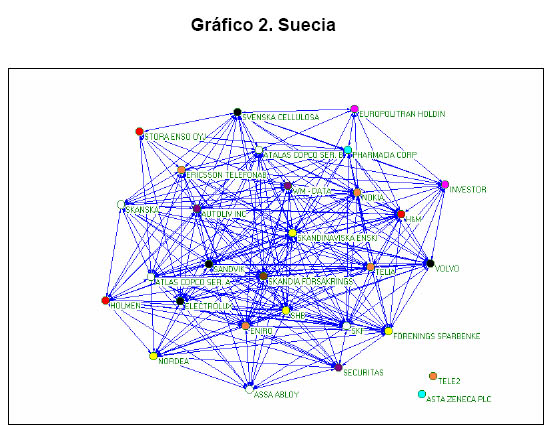
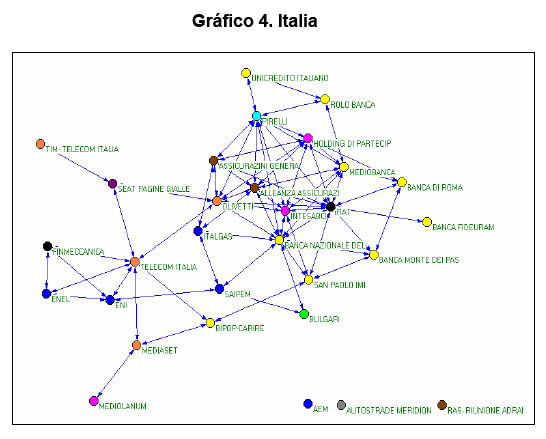
| People have used the idea of "social network" loosely for over a century to connote complex sets of relationships between members of social systems at all scales, from interpersonal to international. In 1954, J. A. Barnes started using the term systematically to denote patterns of ties, encompassing concepts traditionally used by the public and those used by social scientists: bounded groups (e.g., tribes, families) and social categories (e.g., gender, ethnicity). Scholars such as S.D. Berkowitz, Stephen Borgatti, Ronald Burt, Kathleen Carley, Martin Everett, Katherine Faust, Linton Freeman, Mark Granovetter, David Knoke, David Krackhardt, Peter Marsden, Nicholas Mullins, Anatol Rapoport, Stanley Wasserman, Barry Wellman, Douglas R. White, and Harrison White expanded the use of systematic social network analysis |
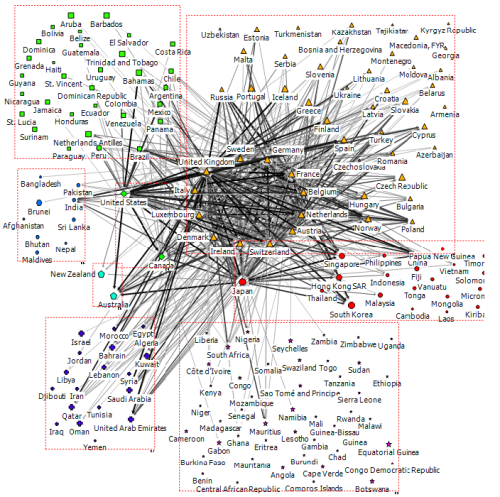
Network view of cross-border banking in 2007 (Minoiu and Reyes 2011) via financial network analysis
|

|
2008Potential Human Rights Uses of
Network Analysis and Mapping Skye Bender-deMoll
2000
THE KNOWLEDGE IN THE NETWORK
David Lazer, Alice Andre-Clark (Governance school) |
/
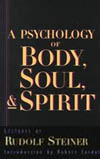
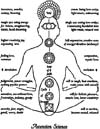
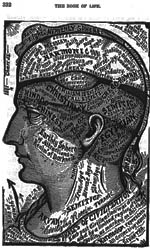 1909
FROM the “very early
New age imagery”(theosophy) 1909
FROM the “very early
New age imagery”(theosophy)
back
to 1960:popular psicology
   FROM
the “not that early New age imagery” FROM
the “not that early New age imagery”

|
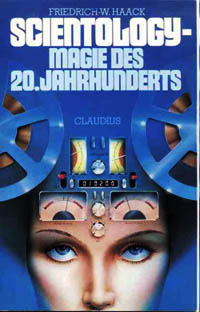
“Engrams,
then; are perceptual recordings made when the analytical mind is turned
off in a manner associated with pain or painful emotion”L.Ron
Hubbard
|
 |
Following his 1970s series for the BBC, many of his ideas have been set into his series of five books: Use Your Memory, Master Your Memory, Use Your Head, The Speed Reading Book and The Mind Map Book. He has since authored or co-authored over 100 books that have appeared in 30 languages. (Tony Buzan) |
1970:
mind maps |
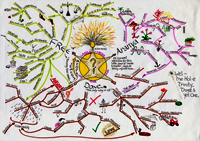 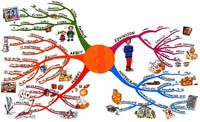 
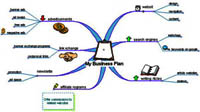  
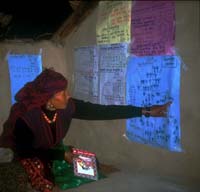
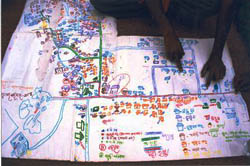
Practical examples:
the technique in the
hands of people (1970)
 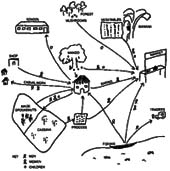  |
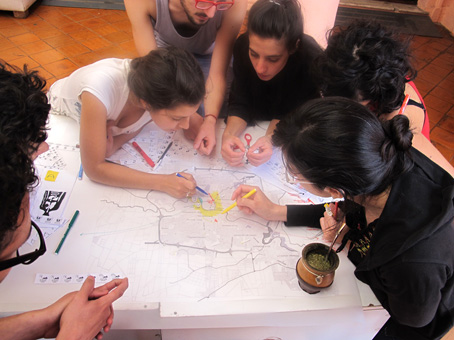
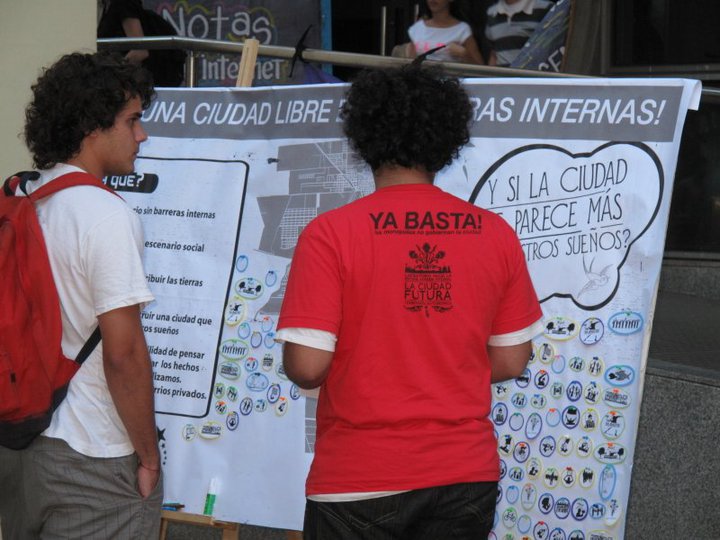
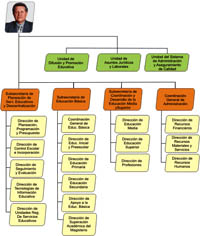
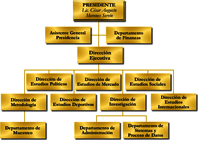
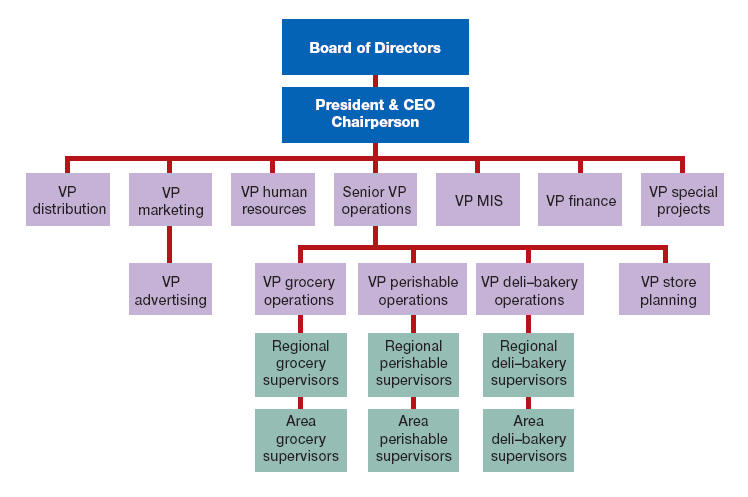
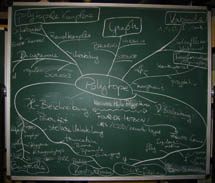
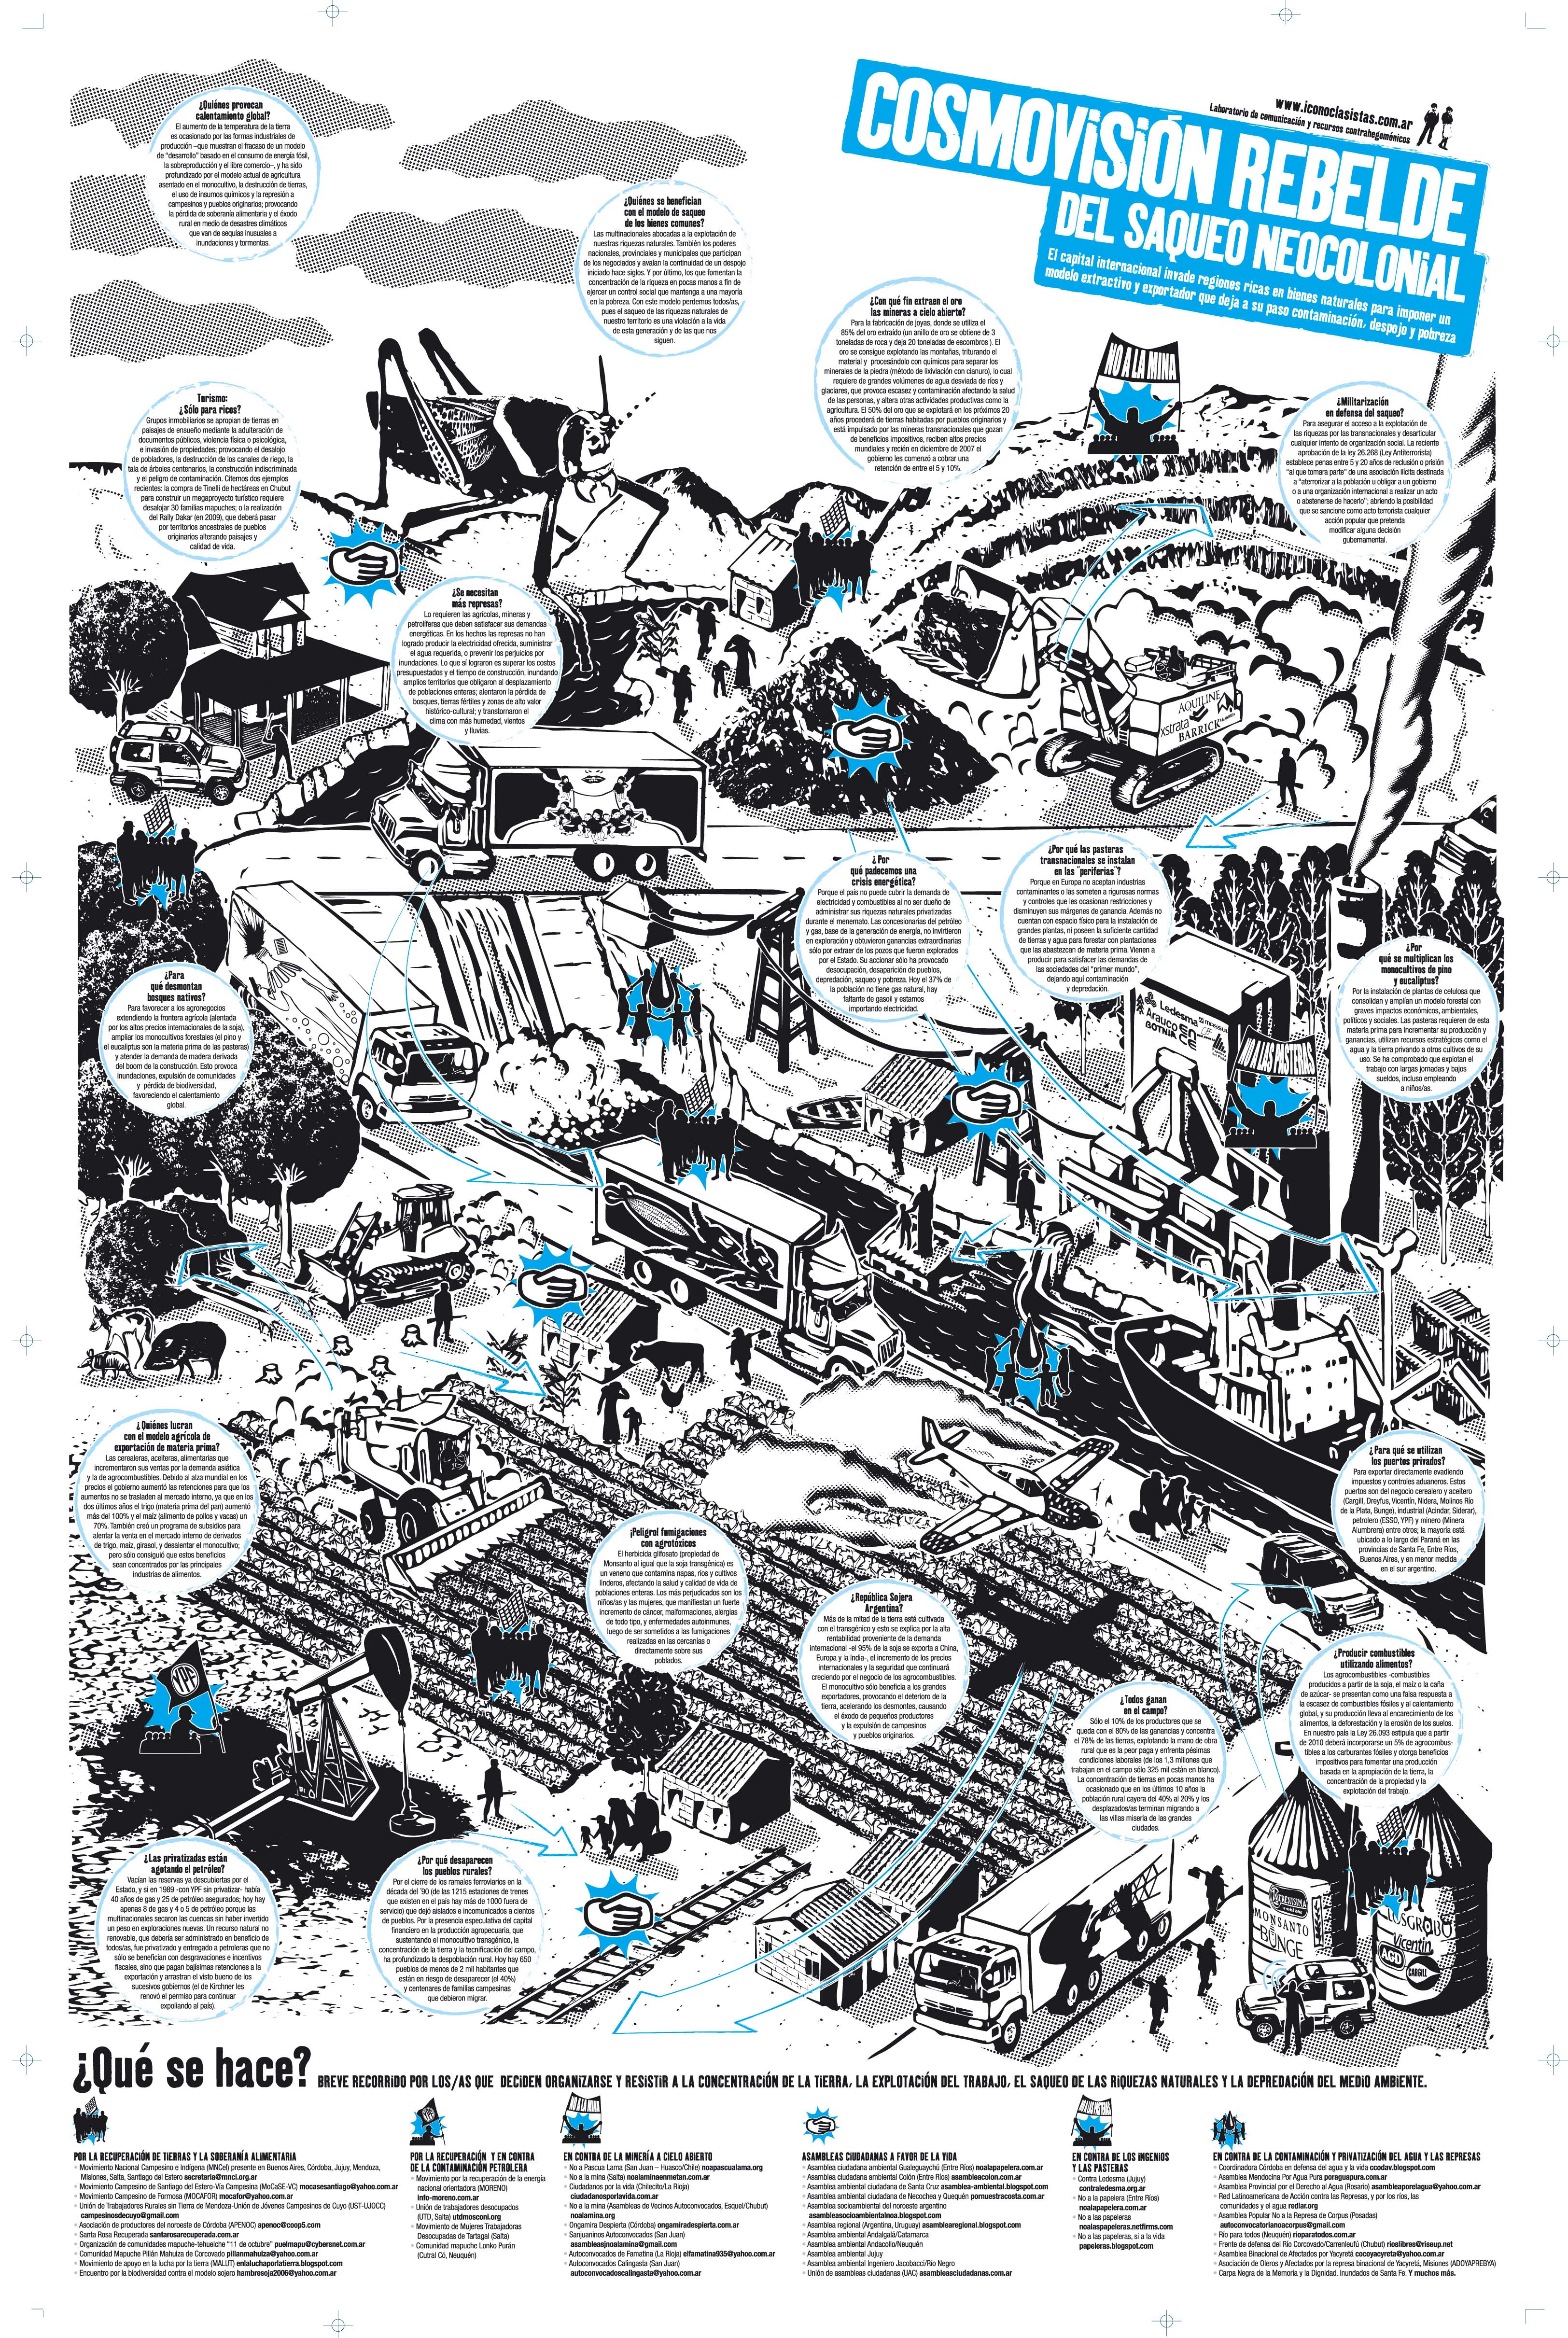
| The tradition of popular, critical and libertarian pedagogies, that dates back to XIX'th century, but also the business and lobby oriented institutions embrace, from 70's on, the use of cartographic practices with educational pruposes.
A wide spectrum of society ranging from social mevements to gubernamental institutions and business coaches are turning graphic analysis in to a popular knowledge. |
|
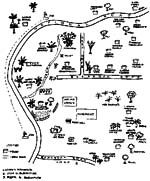
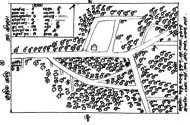
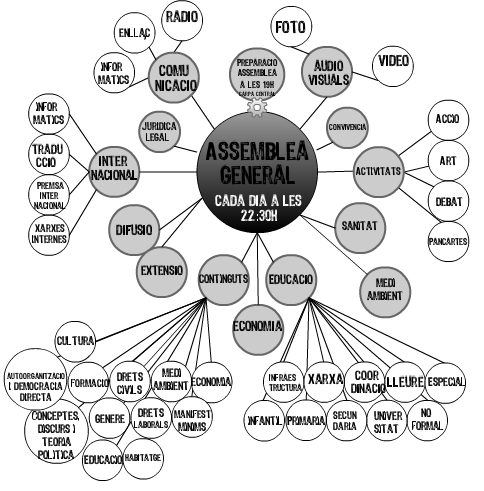
Organization chart of the 15th May civic Movement in Barcelona
while camped in the central square of the city (2011)
|

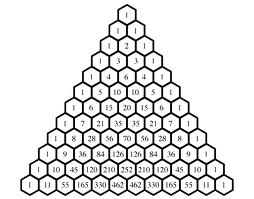
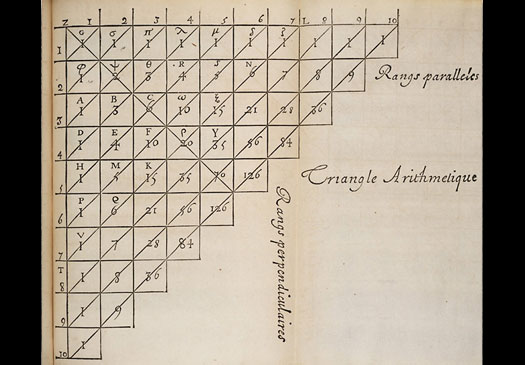
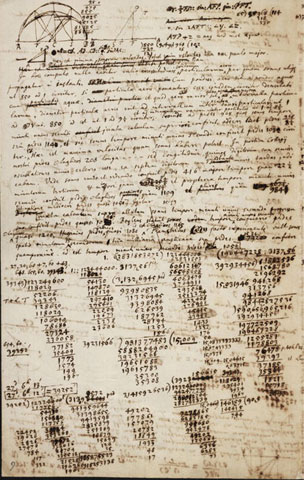
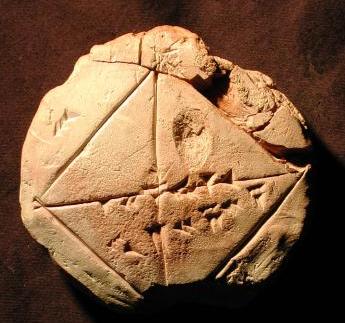 "The point really is that the Babylonians knew that the ratio of diagonal to side was exactly the square root of 2 (...) I believe that we are looking here at the very origins of mathematical reasoning. "

 .
. 


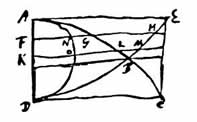

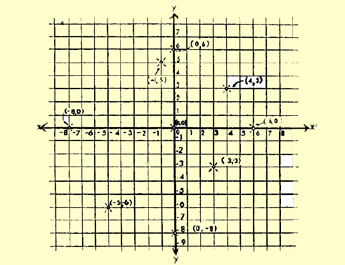
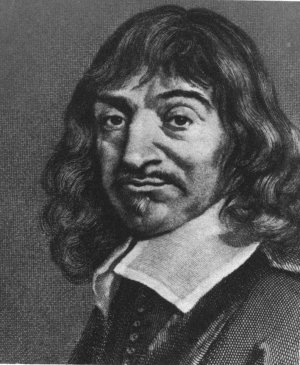 The invention of Cartesian coordinates in the 17th century by René Descartes revolutionized mathematics by providing the first systematic link between Euclidean geometry and algebra. Using the Cartesian coordinate system, geometric shapes (such as curves) can be described by Cartesian equations: algebraic equations involving the coordinates of the points lying on the shape
 It was developed independently by Pierre de Fermat, although Fermat used three dimensions, and did not publish the discovery

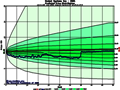
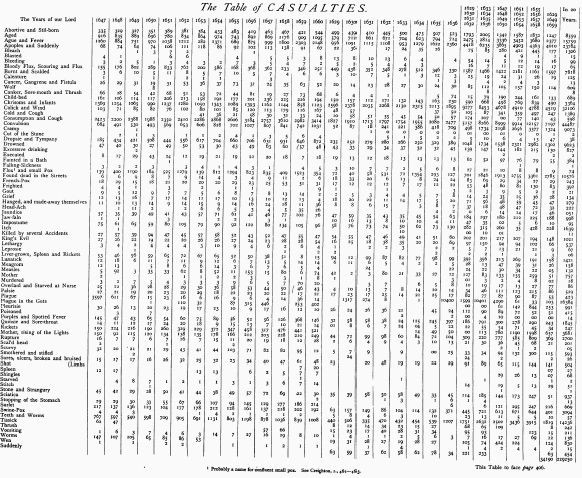
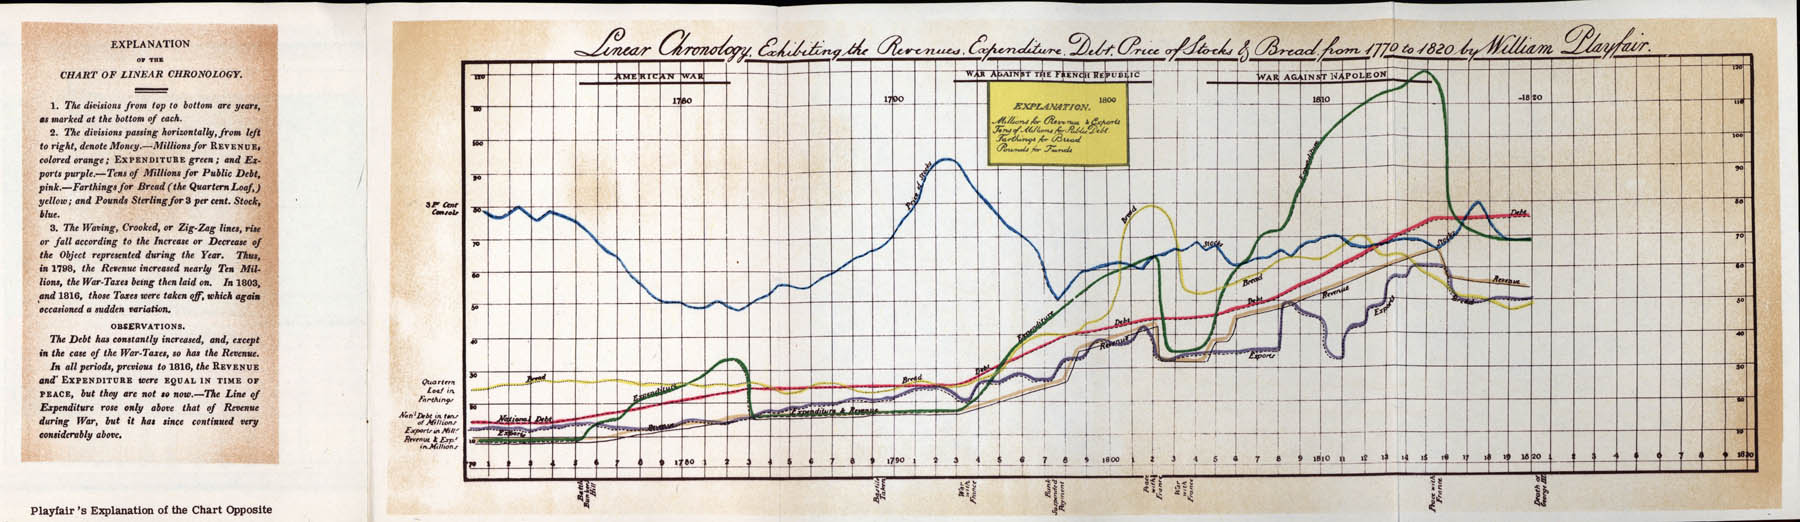
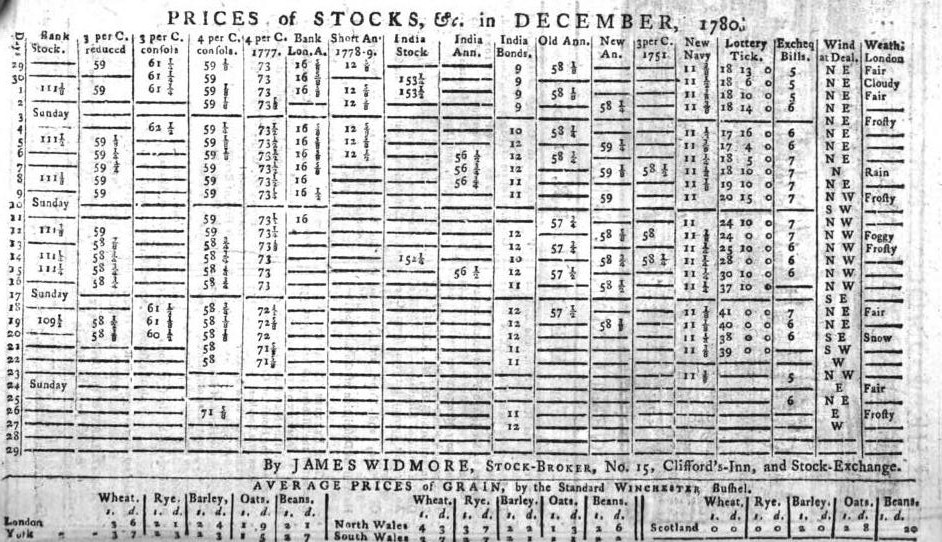
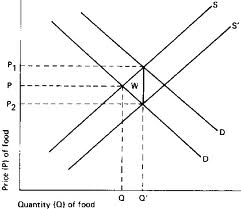
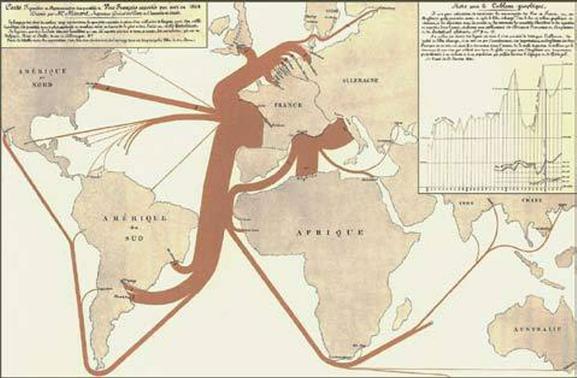
 William Playfair
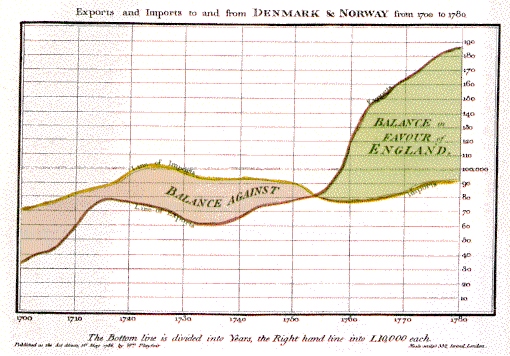


 ,
,


 .
.
 .
. 

 .
.  .
. 


 /
/